Design of experiments (DOE)
In an experiment, we deliberately change one or more process variables (or factors) in order to observe the effect the changes have on one or more response variables. The (statistical) design of experiments (DOE) is an efficient procedure for planning experiments so that the data obtained can be analyzed to yield valid and objective conclusions.
Experimental design
DOE begins with determining the objectives of an experiment and selecting the process factors for the study. An Experimental Design is the laying out of a detailed experimental plan in advance of doing the experiment. Well-chosen experimental designs maximize the amount of "information" that can be obtained for a given amount of experimental effort.
Application
Below are four examples illustrating situations in which experimental design can be used effectively:
-
Choosing Between Alternatives
-
Selecting the Key Factors Affecting a Response
-
Response Surface modeling to:
-
Hit a Target
-
Reduce Variability
-
Maximize or Minimize a Response
-
Make a Process Robust
-
Seek Multiple Goals
-
Regression Modeling
Example: mixture experiment
During the development of a new detergent, experimenters varied three components: X1-water, X2-alcohol and X3-urea.
These three components add to 9% of the total volume when measured in their original units, other ingredients were kept constant.
Objective: To find the proportion of water, alcohol and urea which will minimize the viscosity of the detergent.
Summary of statistical findings
Mixture problems are in many ways similar to other experimental optimization experiments, except for one important aspect: the properties of the final product do not depend on the quantities of its components but on the relative proportions of these components.
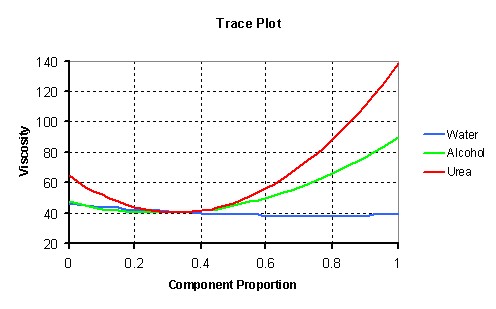
The fitted regression model shows that the blend alcohol-urea has the strongest synergistic effect on the viscosity of the detergent. The effect is highly significant (p<0.0001). The proportion of water in the blend has relatively little effect on the viscosity.
The effectiveness of all components is clearly shown in a trace plot:

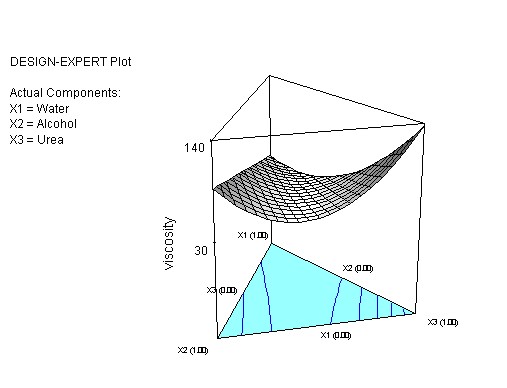
A 3-D plot visualizes the relationships between the blends components and the viscosity:

By using an iterative optimization procedure we can obtain a blend which gives a minimum viscosity at 74% water, 2% alcohol and 24% urea. This blend will give a viscosity of 33.2 units (95% confidence interval from 19.6 to 46.8 units).